In 2022 the Levelling Up White Paper confirmed that regional inequalities in the UK have been steadily widening over recent decades, and that one of the key drivers of this divergence has been rapidly growing levels of income per head and productivity in London and the South East. However, a recent set of articles have questioned this diagnosis and suggested that it is already out of date. Concern has been expressed in a number of quarters that London’s economy itself has faltered and needs support and stimulus as much as any other city or region of the UK: that London needs ‘levelling up’ as much as any of the ‘left behind’ areas of the country (Adonis, 2021). Wolf, for example, argues that the UK now has ‘two regional problems’: not just the lagging deindustrialised regions of northern Britain, but also a stagnation of the economies of London and the South East, the two former ’growth engines’ of the national economy. And the Centre for Cities has argued that the stalling of London’s productivity growth is the ‘main cause’ of the national slowdown in productivity. This has led to a questioning of ‘levelling up.’
Figure 1 shows the growth of Gross Value Added (in 2019 prices), as a measure of economic activity, for the major regions over 1998 to 2020. The falls in GVA during the financial crisis and again with the onset of the COVID pandemic are evident in every region. But what is also clear is how London’s recovery from the financial crisis has actually been far more robust than in the rest of the UK. In terms of basic economic growth, therefore, it would be difficult to argue that London’s economy has ‘stalled’, or that the long-standing disparity in economic dynamism between London and the rest of the national economy has suddenly come to an end. As the Centre for Cities itself notes, on most economic indicators this disparity has continued to widen.
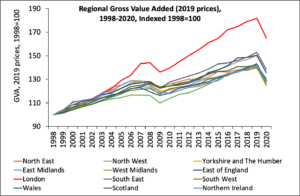
Figure 1: Economic Growth (of GVA at 2019 prices) by Region, 1998-2020, Indexed 1998=100 (Data source: ONS)
There has, however, been an inadequate amount of research into local and regional differences in productivity changes. What work exists often uses labour productivity measured by gross value added (GVA) per filled job, and we will use this indicator in what follows. Nationally, the UK’s productivity growth has been minimal since the financial crisis. From an average annual rate of 2.07 percent (in 2019 prices) over 1998-2007, productivity growth slowed to a negligible 0.75 percent per annum over 2009-2019. No region has escaped, London included (Figure 2).
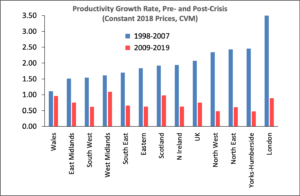
Figure 2: Growth of Productivity (GVA at 2019 prices, CMV, per Filled Job), by Region, pre- and post-Crisis (Data source: ONS)
Although London’s productivity growth fell from an annual average of 3.50 percent over 1998-2007 to 0.89 percent per annum over 2009-2020, this reduced rate of growth was nevertheless higher than that in any other region bar Scotland, West Midlands and Wales, so its relative productivity in 2019 was still above that in 1998 (Figure 3). The Centre for Cities’ analysis, however, argues that London’s growth in productivity since the crisis has fallen marginally below the national rate. But their figure is based on the period from 2007 to 2020 which includes the periods of productivity decline in the capital during both the crisis and the COVID pandemic. Small statistical steps such as this make a large difference to the perception of London’s relative recovery.
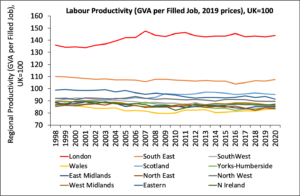
Figure 3: Productivity (GVA in 2019 prices, CMV, per Filled Job), by Region, 1998-2020, Indexed UK=100 (Data source: ONS)
Within London itself, however, there have been significant local differences in productivity growth over the post-crisis period (Figure 4). The annual rate of productivity growth has been highest in Kensington-Chelsea-Hammersmith, Haringey-Islington, and Westminster, but negative in Brent, Barking-Dagenham-Havering, Camden-City of London, and Tower Hamlets. The latter boroughs, however, have experienced high rates of job growth in the post-crisis period (Figure 4). (Indeed, more generally there has been an inverse relationship across London boroughs between productivity growth and job growth (r=-0.58)). It would appear that the jobs created in these boroughs have not been high productivity jobs and their employment boom has been a key factor behind their lower labour productivity growth.
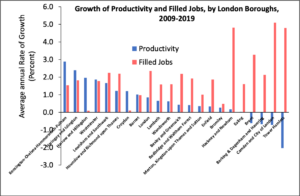
Figure 4: Growth of Productivity (GVA in 2019 prices, CMV, per Filled Job), and in Numbers of Filled Jobs, by London Boroughs, 2009-2019 (Data source: ONS)
The decline in productivity in financial services is a key cause of these figures. We know that productivity has fallen in most industries. However, the large share of total GVA produced by financial services in the UK means that the outcomes of the productivity slowdown in this sector have been particularly consequential. Figure 5 shows the productivity trends in the whole economy, manufacturing and financial services, and highlights the particularly marked slowdown in the latter since the crisis.
Much concern has been expressed over the loss of dynamism of London’s financial economy since the crisis of 2008. The UK’s exit from the European Union has compounded this concern, and prompted the Government to announce a new wave of deregulation – the so-called Edinburgh Reforms – to restore and promote the global competitiveness of London’s financial sector. If implemented this ‘Big Bang 2.0’ will dismantle much of the regulatory framework introduced after the financial crisis, itself a result of the excessive risk taking encouraged in large part by the large-scale deregulation of the banking system by the Thatcher Government in 1986 (‘Big Bang 1.0’). (It is interesting that in his recent Nobel Prize Lecture, Ben Bernanke, the former Chair of the US Federal Reserve has warned precisely against any new deregulation of the banking system, precisely to prevent another crisis. Given the recent collapse of Silicon Valley Bank in the US, and its contagion to Deutsche Bank, this warning would seem all too pertinent).
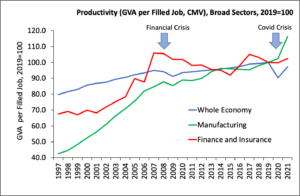
Figure 5: GVA (at constant 2019 prices, CMV) per Filled Job in the UK, for Broad Sectors, 1997-2021 (Data source: ONS)
Riley et al argue that just as the strong pre-crisis growth of financial services, in common with several other service activities (such as ICT) is largely explained by strong growth in total factor productivity (TFP), and that the minimal productivity growth since then has been due to stagnation in TFP growth. What TFP means in this context is far from clear, however. Some argue that London enjoys higher TFP across its sectors than other UK regions and cities because of the strong positive agglomeration externalities that derive from its size. But clearly, London’s agglomeration advantages have not suddenly weakened since 2008, so the fall in TFP growth must be due to other factors. In any case, the decline in productivity in financial services has not been confined to London. All regions have witnessed a fall in productivity growth in finance since the crisis (Figure 6), and London’s experience has by no means been the worst (both Scotland and the North West have seen more marked slowdowns),
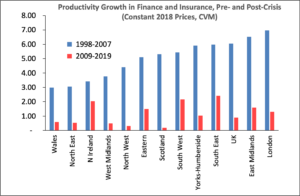
Figure 6: Productivity Growth (GVA at 2019 per Filled Job) in Finance and Insurance, by Region, 1998-2007 and 2009-2019 (Data source: ONS)
In the light of these measurement difficulties and uncertainties, we would urge much more caution in using recent labour productivity measures as grounds for strong conclusions and rapid policy recommendations (and reversals). Many of these statistics are provisional and subject to revisions and modifications. London’s productivity performance has been dominated by trends in the Gross Value Added by financial and other producer services and we need to have a much better understanding of the causes of these trends before we can draw convincing conclusions on development policies in the capital. Rather than encouraging another de-regulatory boom in finance with all its inherent risks, comparisons with other European cities over the past decade suggest that it is important to focus on diversifying and widening London’s growth base. In the context of the pandemic’s legacy and the UK’s struggling national economy, key sectors in London are certainly showing evidence of slowdown. However, on most economic measures the capital is not performing worse than other UK regions and on many measures its recovery since 2009 has been more resilient than other cities. Despite the obvious policy appeal of playing down regional inequalities and calling for yet more public investment in London, it is questionable whether the economic problems in the capital are worse than in other UK cities, or that there has been a fundamental shift in the character of regional inequality in the UK. And it would certainly be a mistake to dismiss the need and commitment to level up the UK’s left behind places outside of the more prosperous London city-region.

Ron Martin, Emeritus Professor of Economic Geography, University of Cambridge, UK (rlm1@cam.ac.uk)

Peter Sunley, Professor of Economic Geography, University of Southampton, UK (p.j.sunley@soton.ac.uk)
References (with no links)
Adonis, A. (2021) The Short-sightedness of ‘levelling up’, Prospect, 8 December.
Are you currently involved with regional research, policy, and development? The Regional Studies Association is accepting articles for their online blog. For more information, contact the Blog Editor at rsablog@regionalstudies.org.